Weather-Driven Form Fluctuations: Mapping Atmospheric Data Across Soccer Pitch Conditions and Tennis Court Surfaces for Multi-Market Strategy Development
Sage Schmid · Aug 22, 2026
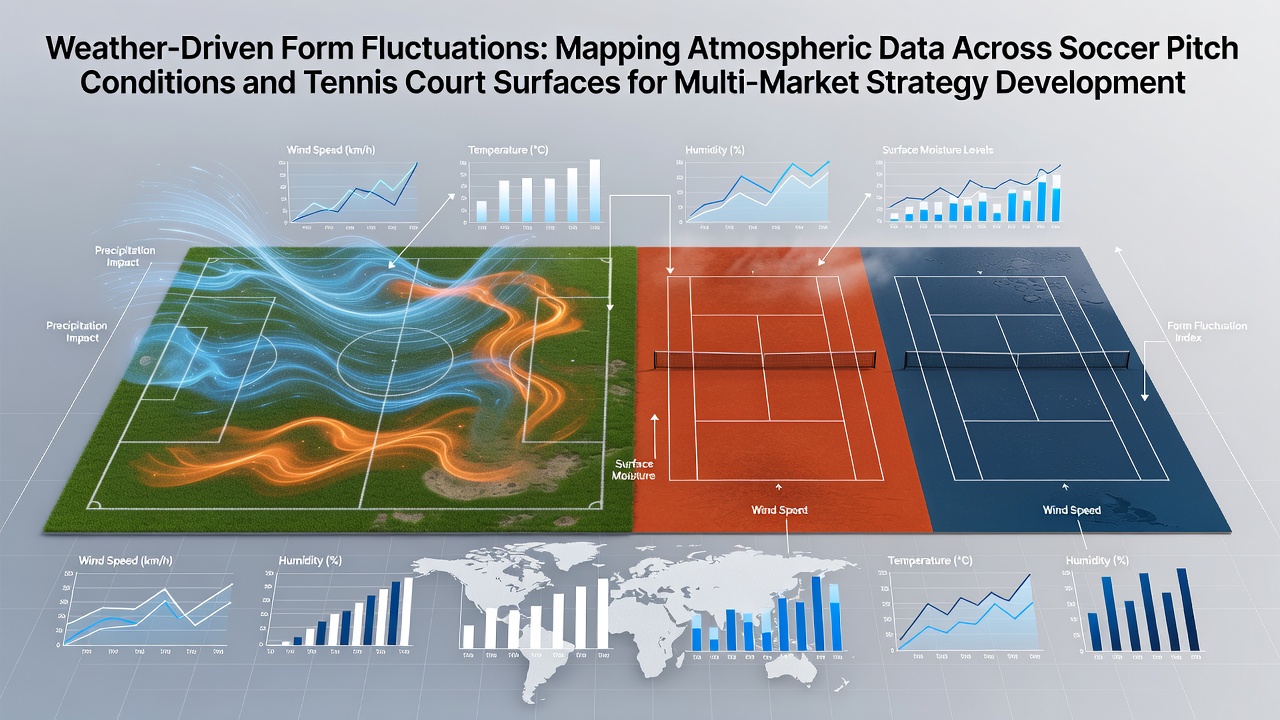
Weather-Driven Form Fluctuations: Mapping Atmospheric Data Across Soccer Pitch Conditions and Tennis Court Surfaces for Multi-Market Strategy Development
Atmospheric conditions shape playing surfaces in ways that alter ball behavior and player movement across soccer pitches and tennis courts, and organizations now map these variables with increasing precision to support decisions in multiple markets. Researchers collect data on temperature, humidity, wind speed, and precipitation through networks of ground sensors combined with satellite observations, then correlate those readings with surface performance metrics recorded during matches and tournaments.
Soccer Pitch Responses to Moisture and Temperature Shifts
Grass pitches absorb rainfall at different rates depending on soil composition and drainage systems, which creates measurable changes in ball roll and bounce height. Studies conducted by European meteorological agencies show that pitches exposed to more than 10 millimeters of rain in the preceding 24 hours exhibit reduced friction coefficients, leading to longer slide distances for players and passes that travel farther than expected on drier ground. In warmer conditions above 28 degrees Celsius, evapotranspiration increases and turf stiffens, producing faster surfaces that favor teams accustomed to high-tempo passing sequences.
August 2026 fixtures across major European leagues coincide with peak summer dryness in southern regions while northern venues experience sporadic thunderstorms, patterns that atmospheric models forecast several days in advance. Analysts integrate these forecasts with historical pitch data to identify when certain venues deviate from their seasonal norms, allowing cross-market comparisons between domestic league matches and international qualifiers played on the same surfaces.
Tennis Court Surface Variations Under Humidity and Wind
Clay courts retain moisture longer than hard courts, which slows ball speed and increases topspin effectiveness when relative humidity exceeds 65 percent. Data from the Australian Bureau of Meteorology paired with court maintenance logs indicate that hard courts in arid climates lose grip as temperatures rise above 32 degrees Celsius because the acrylic surface expands and becomes slicker. Grass courts, by contrast, dry quickly under moderate wind, restoring pace within hours after light showers.
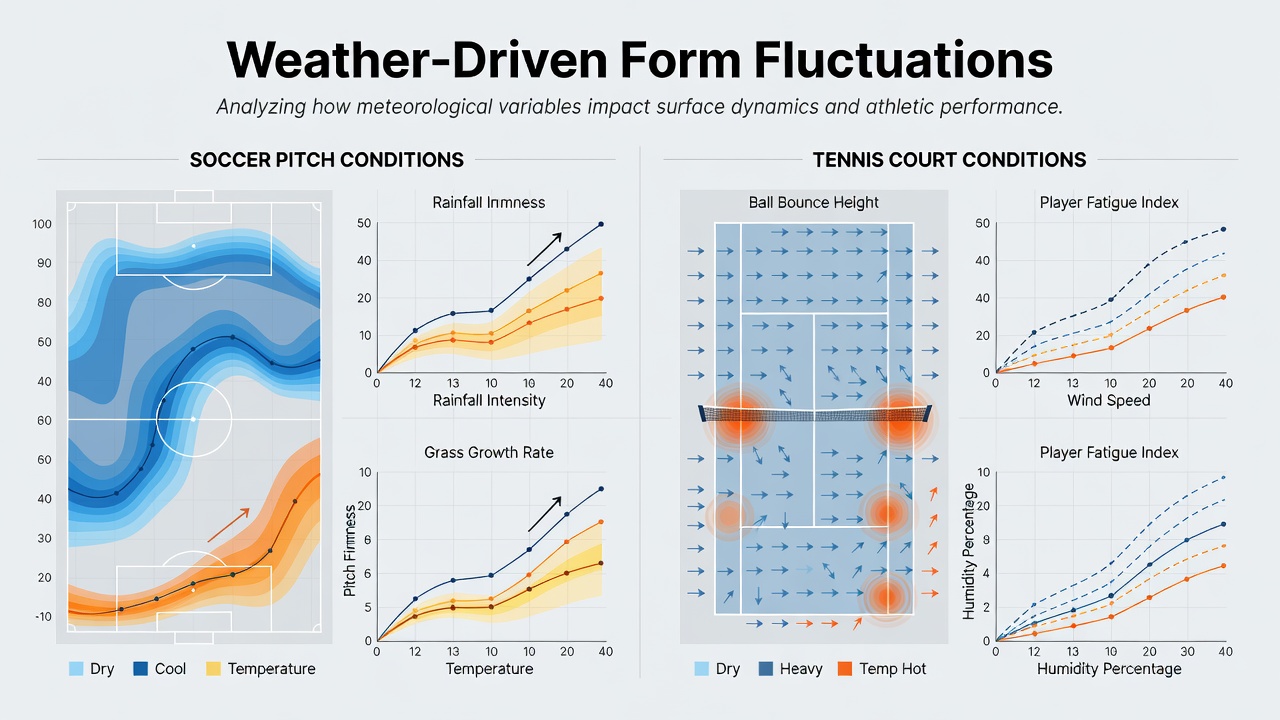
Multi-surface tournaments held in late summer expose players to rapid transitions between these conditions, and researchers track how atmospheric pressure gradients influence ball trajectory on outdoor courts. One dataset compiled during the 2025 North American hard-court swing revealed that sustained winds above 15 kilometers per hour shifted serve landing patterns by an average of 8 centimeters toward the sideline on faster courts, an effect less pronounced on slower clay venues.
Integrating Atmospheric Datasets for Cross-Market Analysis
Agencies such as the European Centre for Medium-Range Weather Forecasts supply hourly resolution grids that sports analytics teams overlay with venue-specific surface databases. These combined layers allow identification of periods when soccer pitch conditions align with tennis court states across geographically separated events, supporting simultaneous evaluation of multiple competitions. Real-time sensor arrays installed at select stadiums transmit moisture content and temperature readings every 15 minutes, feeding into models that adjust expected performance baselines before matches begin.
Academic papers published by university research groups in North America and Australia document how wind vectors interact with stadium architecture to create microclimates on pitches and courts. Observers note that enclosed soccer venues trap humidity near the turf while open tennis arenas permit greater airflow, producing divergent surface responses even under identical regional forecasts. Such distinctions become relevant when strategy teams compare in-play metrics across leagues and circuits that share overlapping weather windows.
Future Mapping Techniques and Data Sources
Advances in drone-based thermal imaging now supplement fixed weather stations, capturing surface temperature variations at centimeter-scale resolution during active play. The National Oceanic and Atmospheric Administration provides open-access radar and satellite products that organizations adapt for sports applications, linking precipitation intensity maps with post-match surface recovery timelines. These tools enable finer calibration of performance models that account for both immediate weather effects and longer-term turf or court degradation patterns.
Cross-referencing atmospheric archives with performance statistics from multiple continents reveals recurring seasonal signatures, such as increased error rates on clay courts following overnight dew formation or altered passing completion percentages on soccer pitches after brief but intense rainfall. Analysts continue refining algorithms that weight these variables according to venue history and current maintenance practices, producing updated surface condition indices that inform decisions across diverse event calendars.
Conclusion
Systematic mapping of atmospheric data against soccer pitch and tennis court conditions supplies objective inputs for performance forecasting and cross-market evaluation. Continued expansion of sensor networks and integration with global weather models supports increasingly granular adjustments to expected outcomes as environmental factors evolve throughout each season.